Heat and cold extremes are causing premature deaths in cities across Europe and climate change is expected to impact the health burden due to temperature changes.
As the planet warms, the number of deaths due to cold weather is expected to decrease. This is because, with climate change, winters are becoming milder, reducing the risks associated with extreme cold. However, this seemingly positive change comes with a significant downside. The research by the EXHAUSTION consortium shows that the decrease in the number of deaths due to cold weather will be largely offset by a dramatic increase of heat-related deaths. The increase in heat-related mortality is due to increasing ambient temperatures and more days of extreme heat resulting from a warming climate
“In summary, while fewer people might die from cold conditions in the future, this benefit is overshadowed by the growing threat of extreme heat.”
Future demographic, climate change and adaptation pathways form the basis of the scenarios used in projections of temperature-related mortality risks. A combination of shared socioeconomic pathways (SSP) and representative concentration pathways (RCP) have been considered for two visualisations shown below, the scenarios are described as:
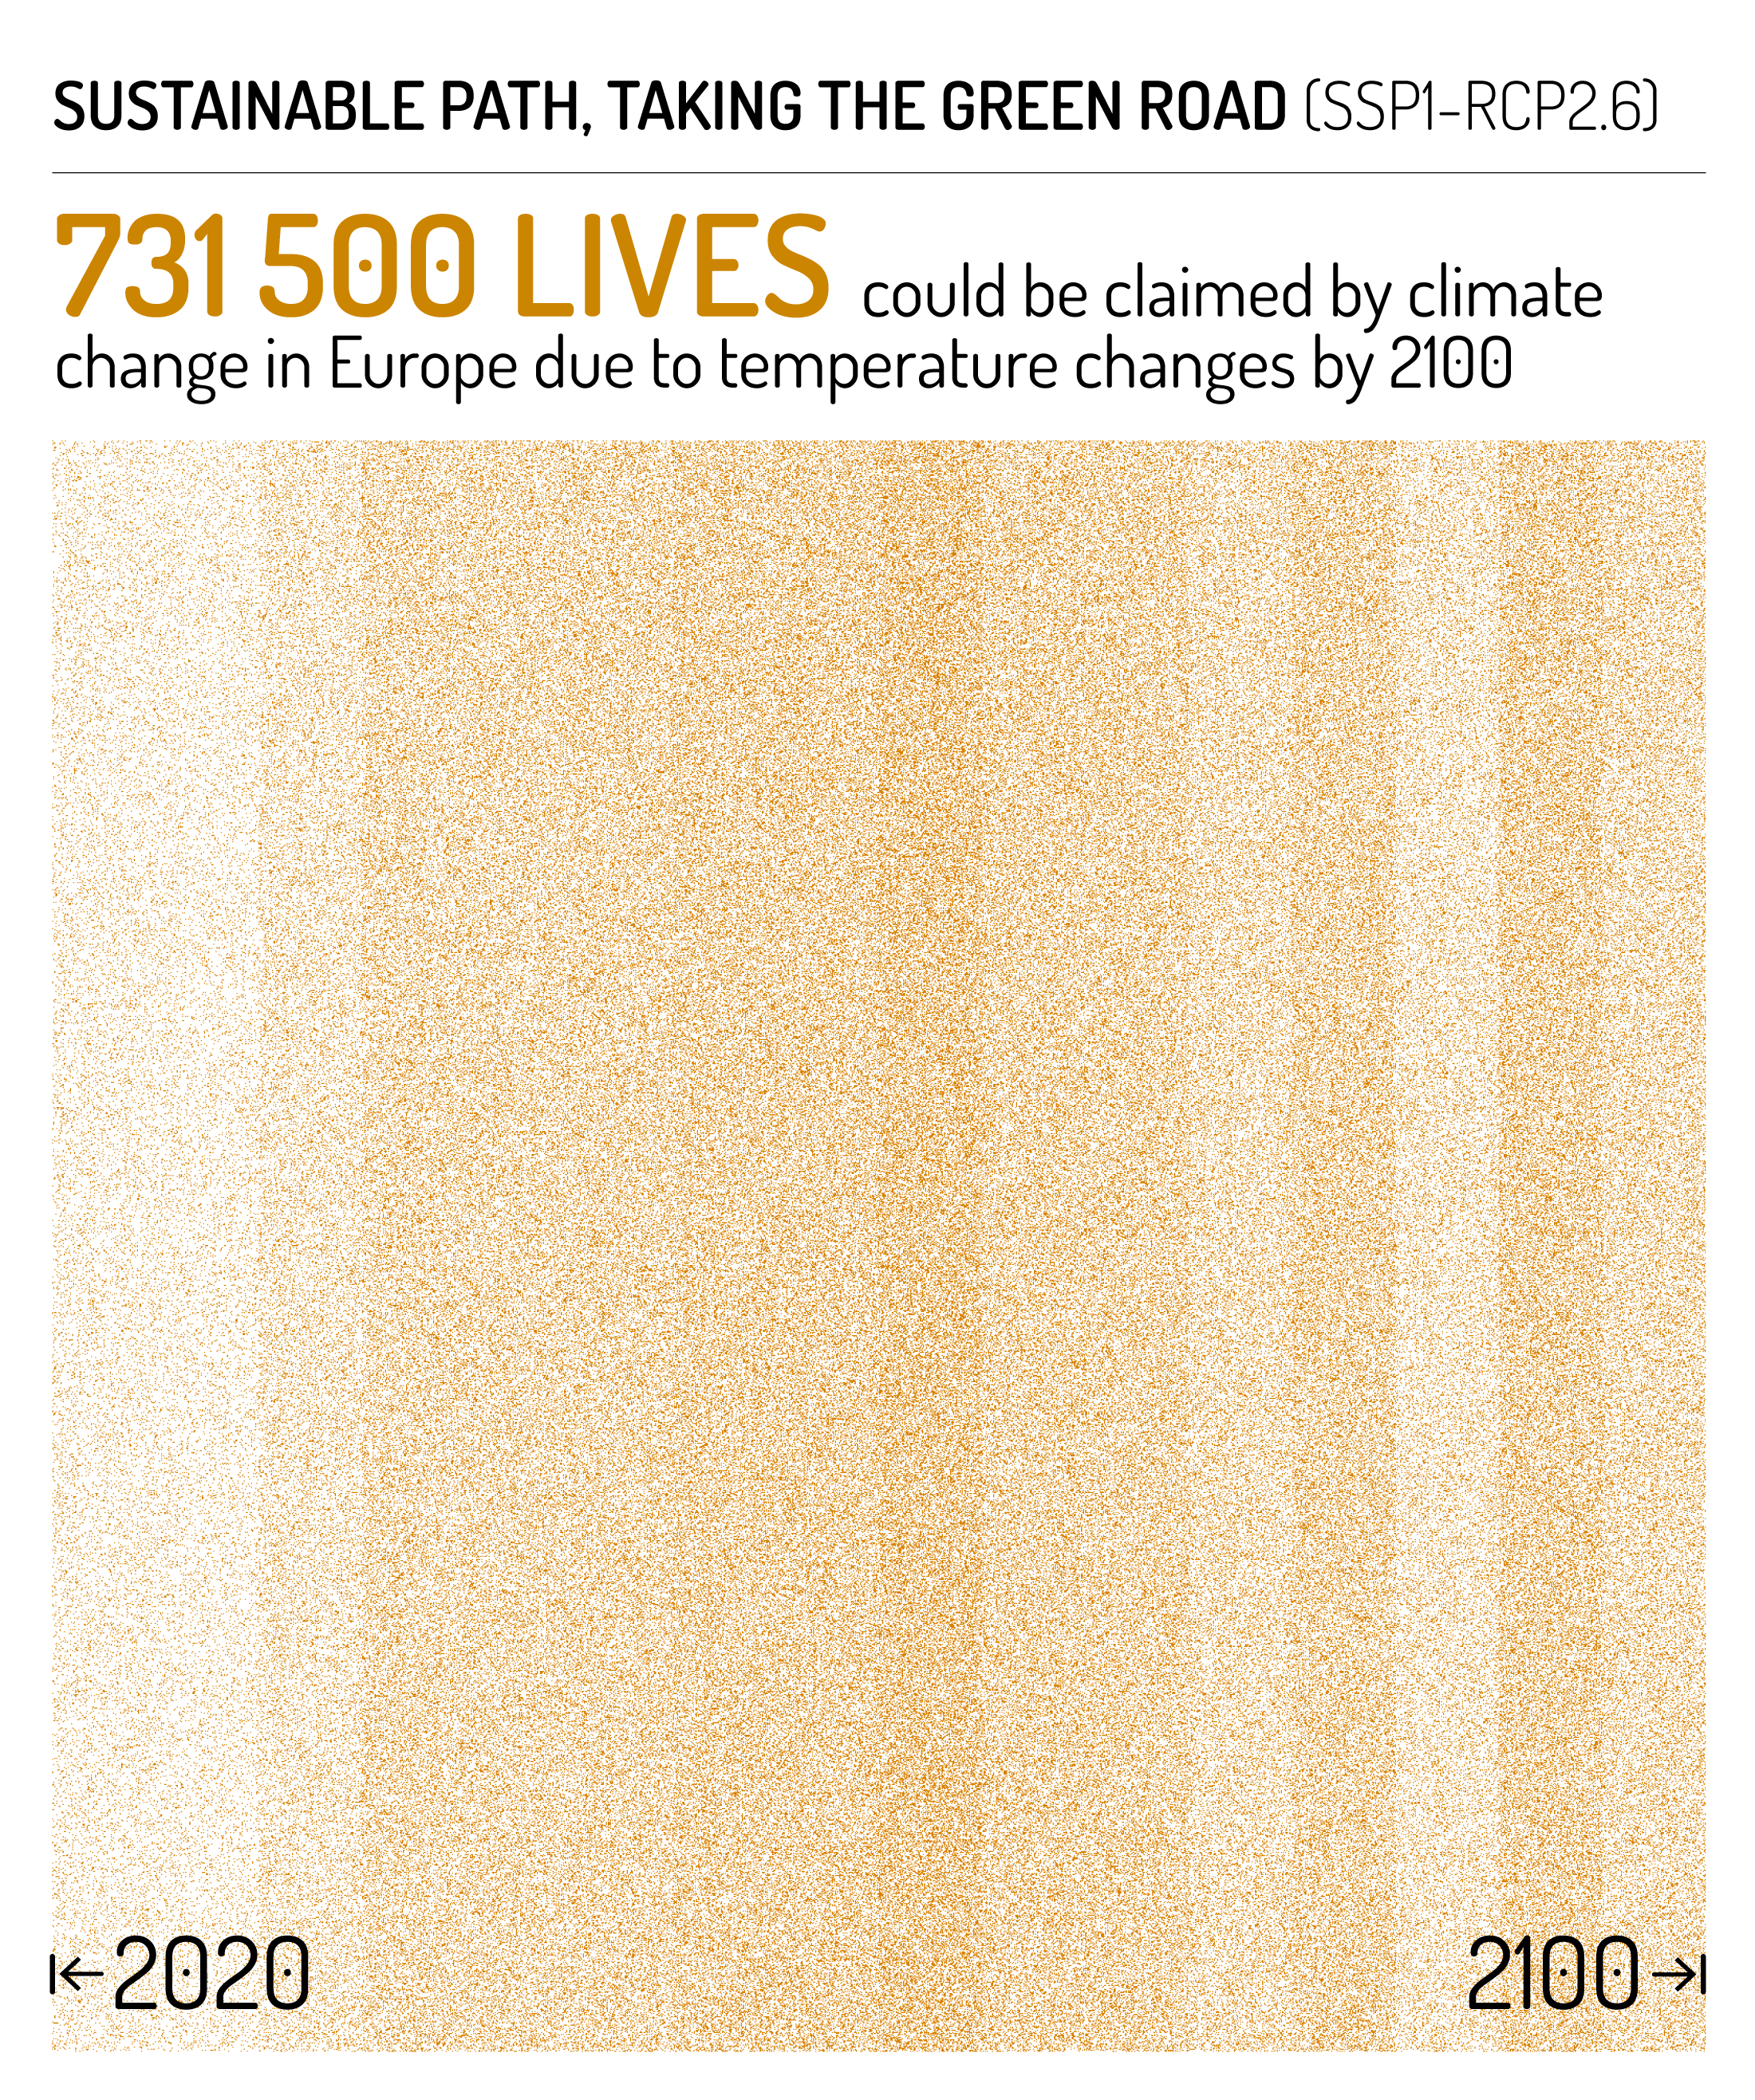
A sustainable path “Low impact, Taking the green road” SSP1-RCP2.6
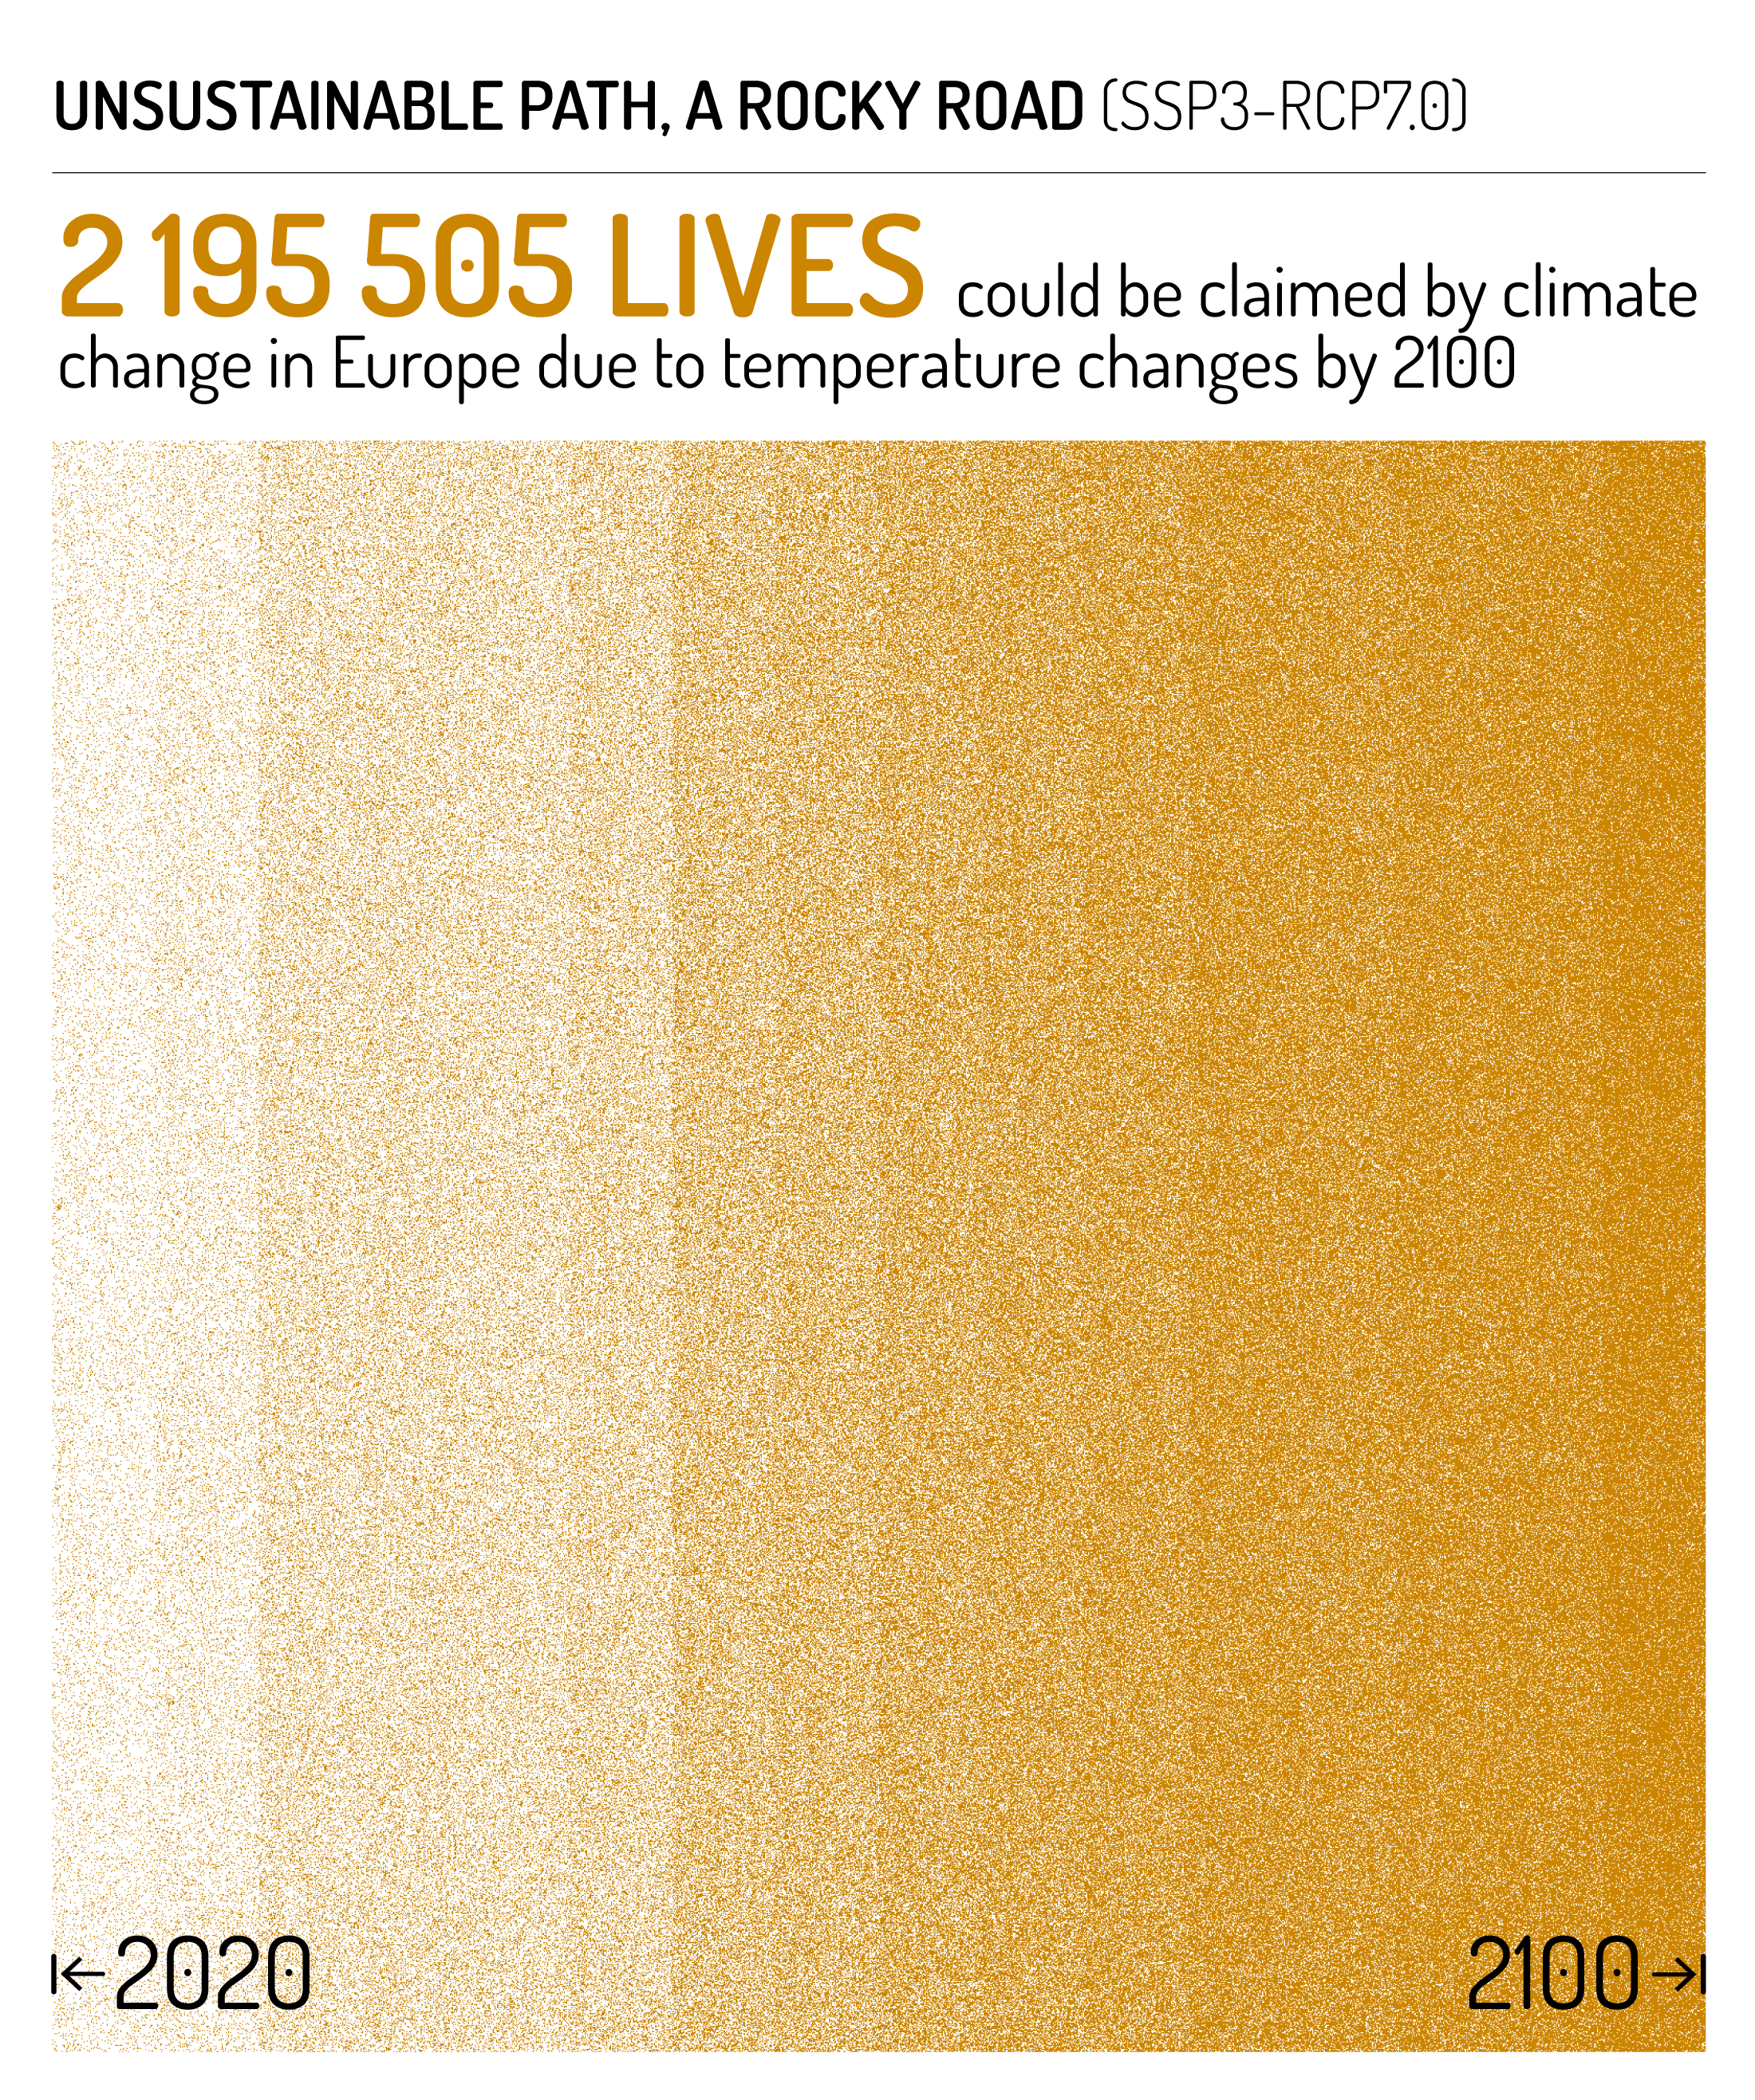
An unsustainable path “High impact, A rocky road”, SSP3-RCP7.0
Projected total number of temperature-related deaths caused by climate change between 2020 and 2100
These visualisations show the projected net change in the number of deaths caused by heat and cold in European cities between 2020 and 2100.
The total number of dots represents the overall rise in temperature-related deaths caused by climate change. This overall increase is due to the fact that the increase in heat-related deaths is much larger than the number of avoided cold-related deaths. The imbalance results in a steadily growing net increase in premature deaths. Implementing effective actions and policies is crucial to mitigate this net increase and potentially save many lives.
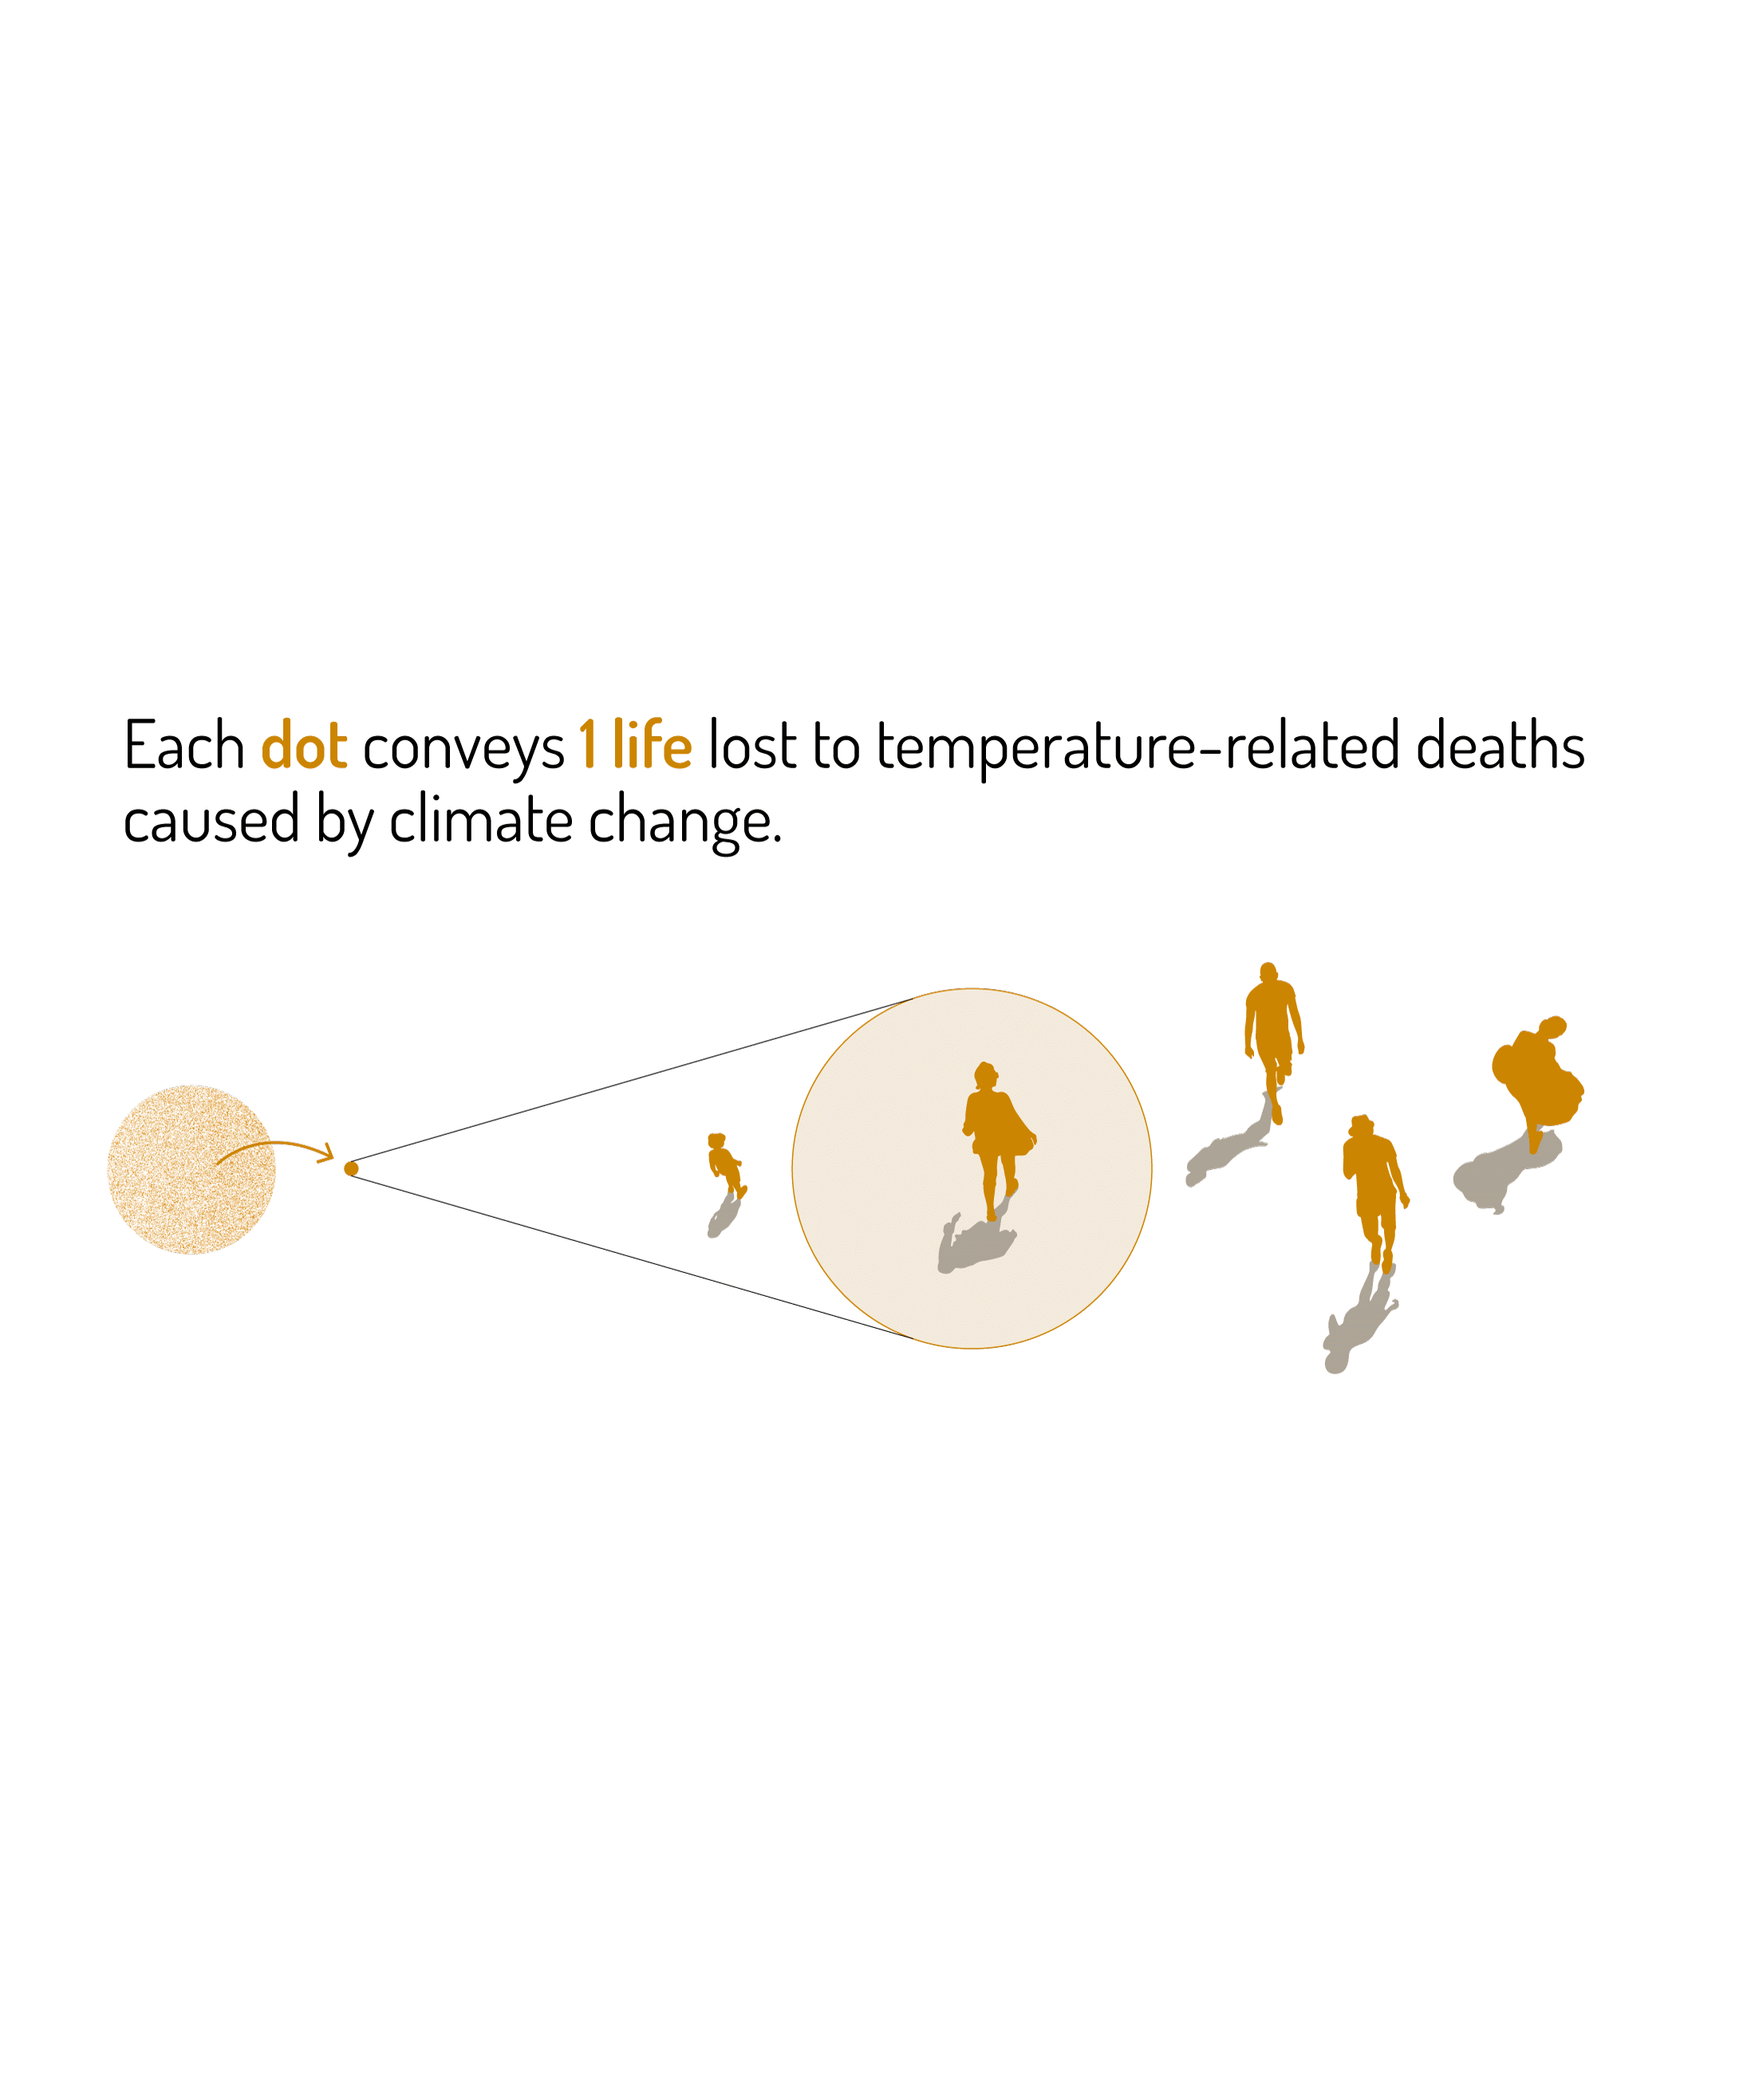
“Though one dot will never truly capture the immense value of a human life, in these visuals each dot symbolises a single human life that is potentially lost.”
The two visualisations show the projections under two different scenarios.The most likely climate change scenario, an unsustainable path and a rocky road (SSP3-RCP7.0), assumes a low priority to environmental action. This scenario leads to global warming reaching 2°C before 2050 and 3°C before 2080. Under this scenario, projections indicate a dramatic net increase in deaths, potentially with more than 2 million lives claimed by climate change by the end of the century.
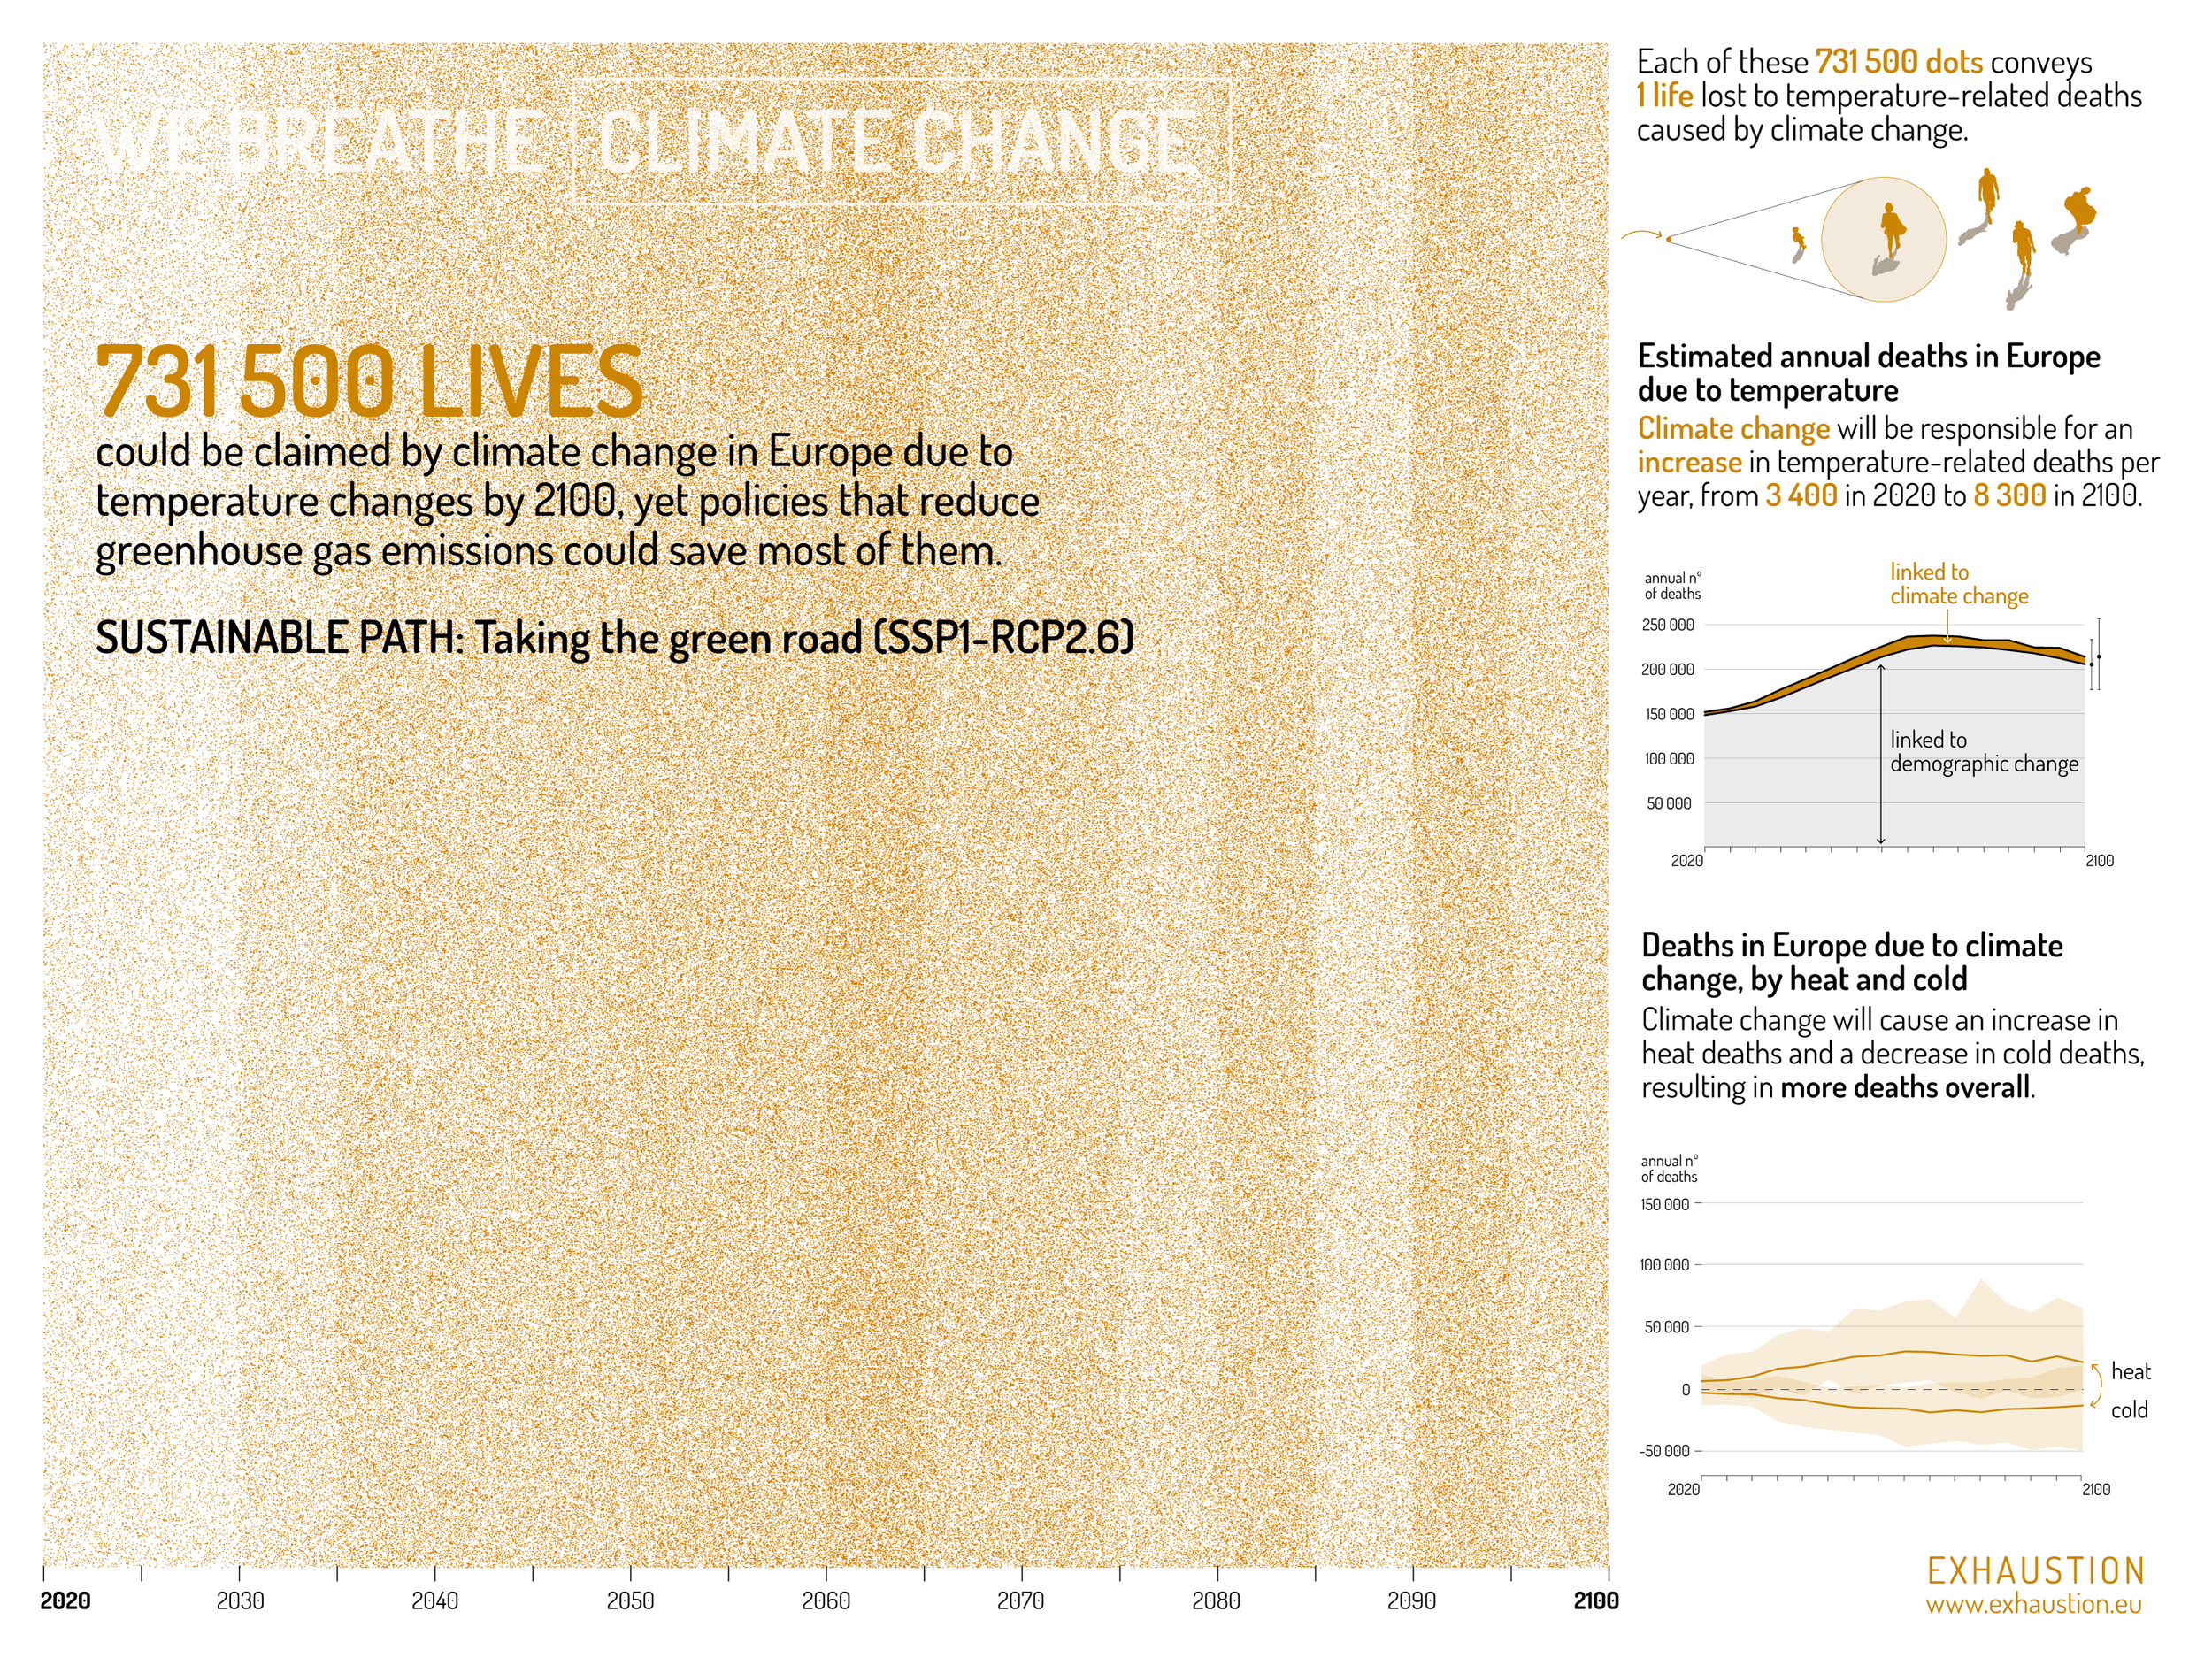
In contrast, the scenario “taking the green road” (SSP1-RCP2.6) is a more optimistic scenario in which the world takes a more sustainable path. Under this scenario, global warming reaches 1.5°C before 2050 but then wears off to likely remain below 2°C. In this context, projections indicate that lives claimed by climate change would peak around 2060 and could sum to 731500 lives by the end of the century. Thus, in this scenario, the temperature-related deaths due to climate change are projected to be only one third of what is expected under the SSP3-RCP7.0 scenario.
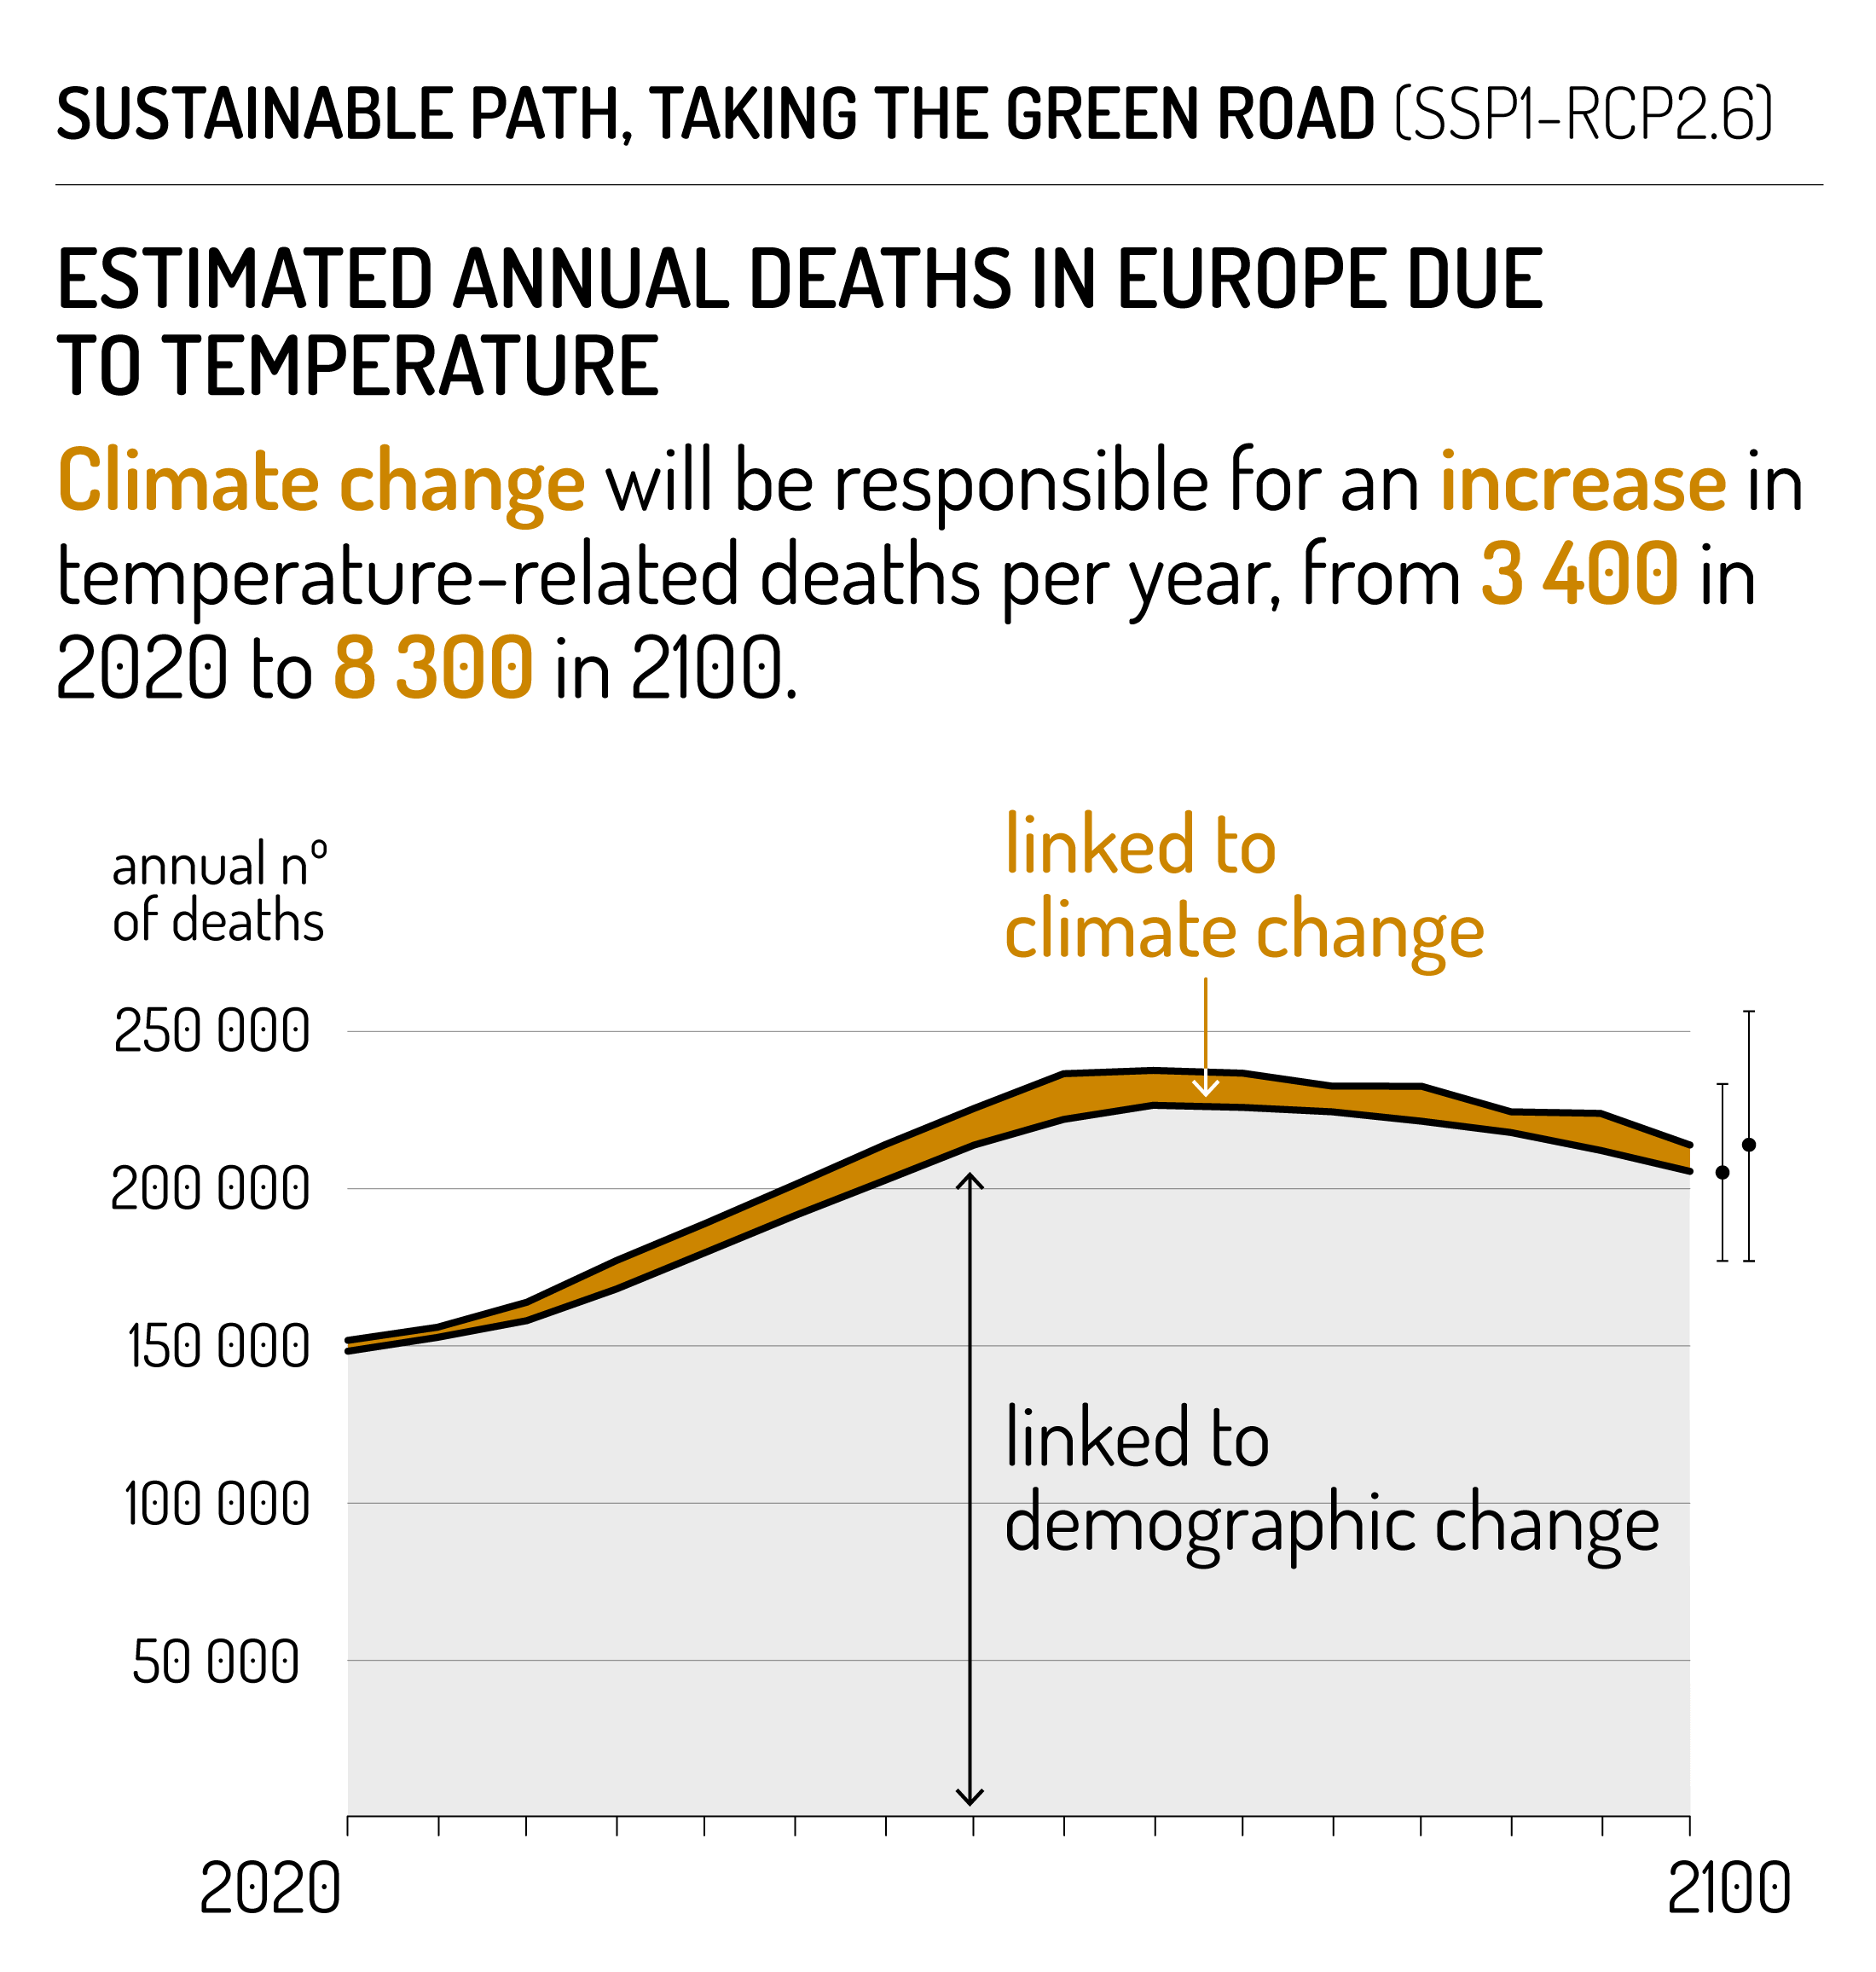
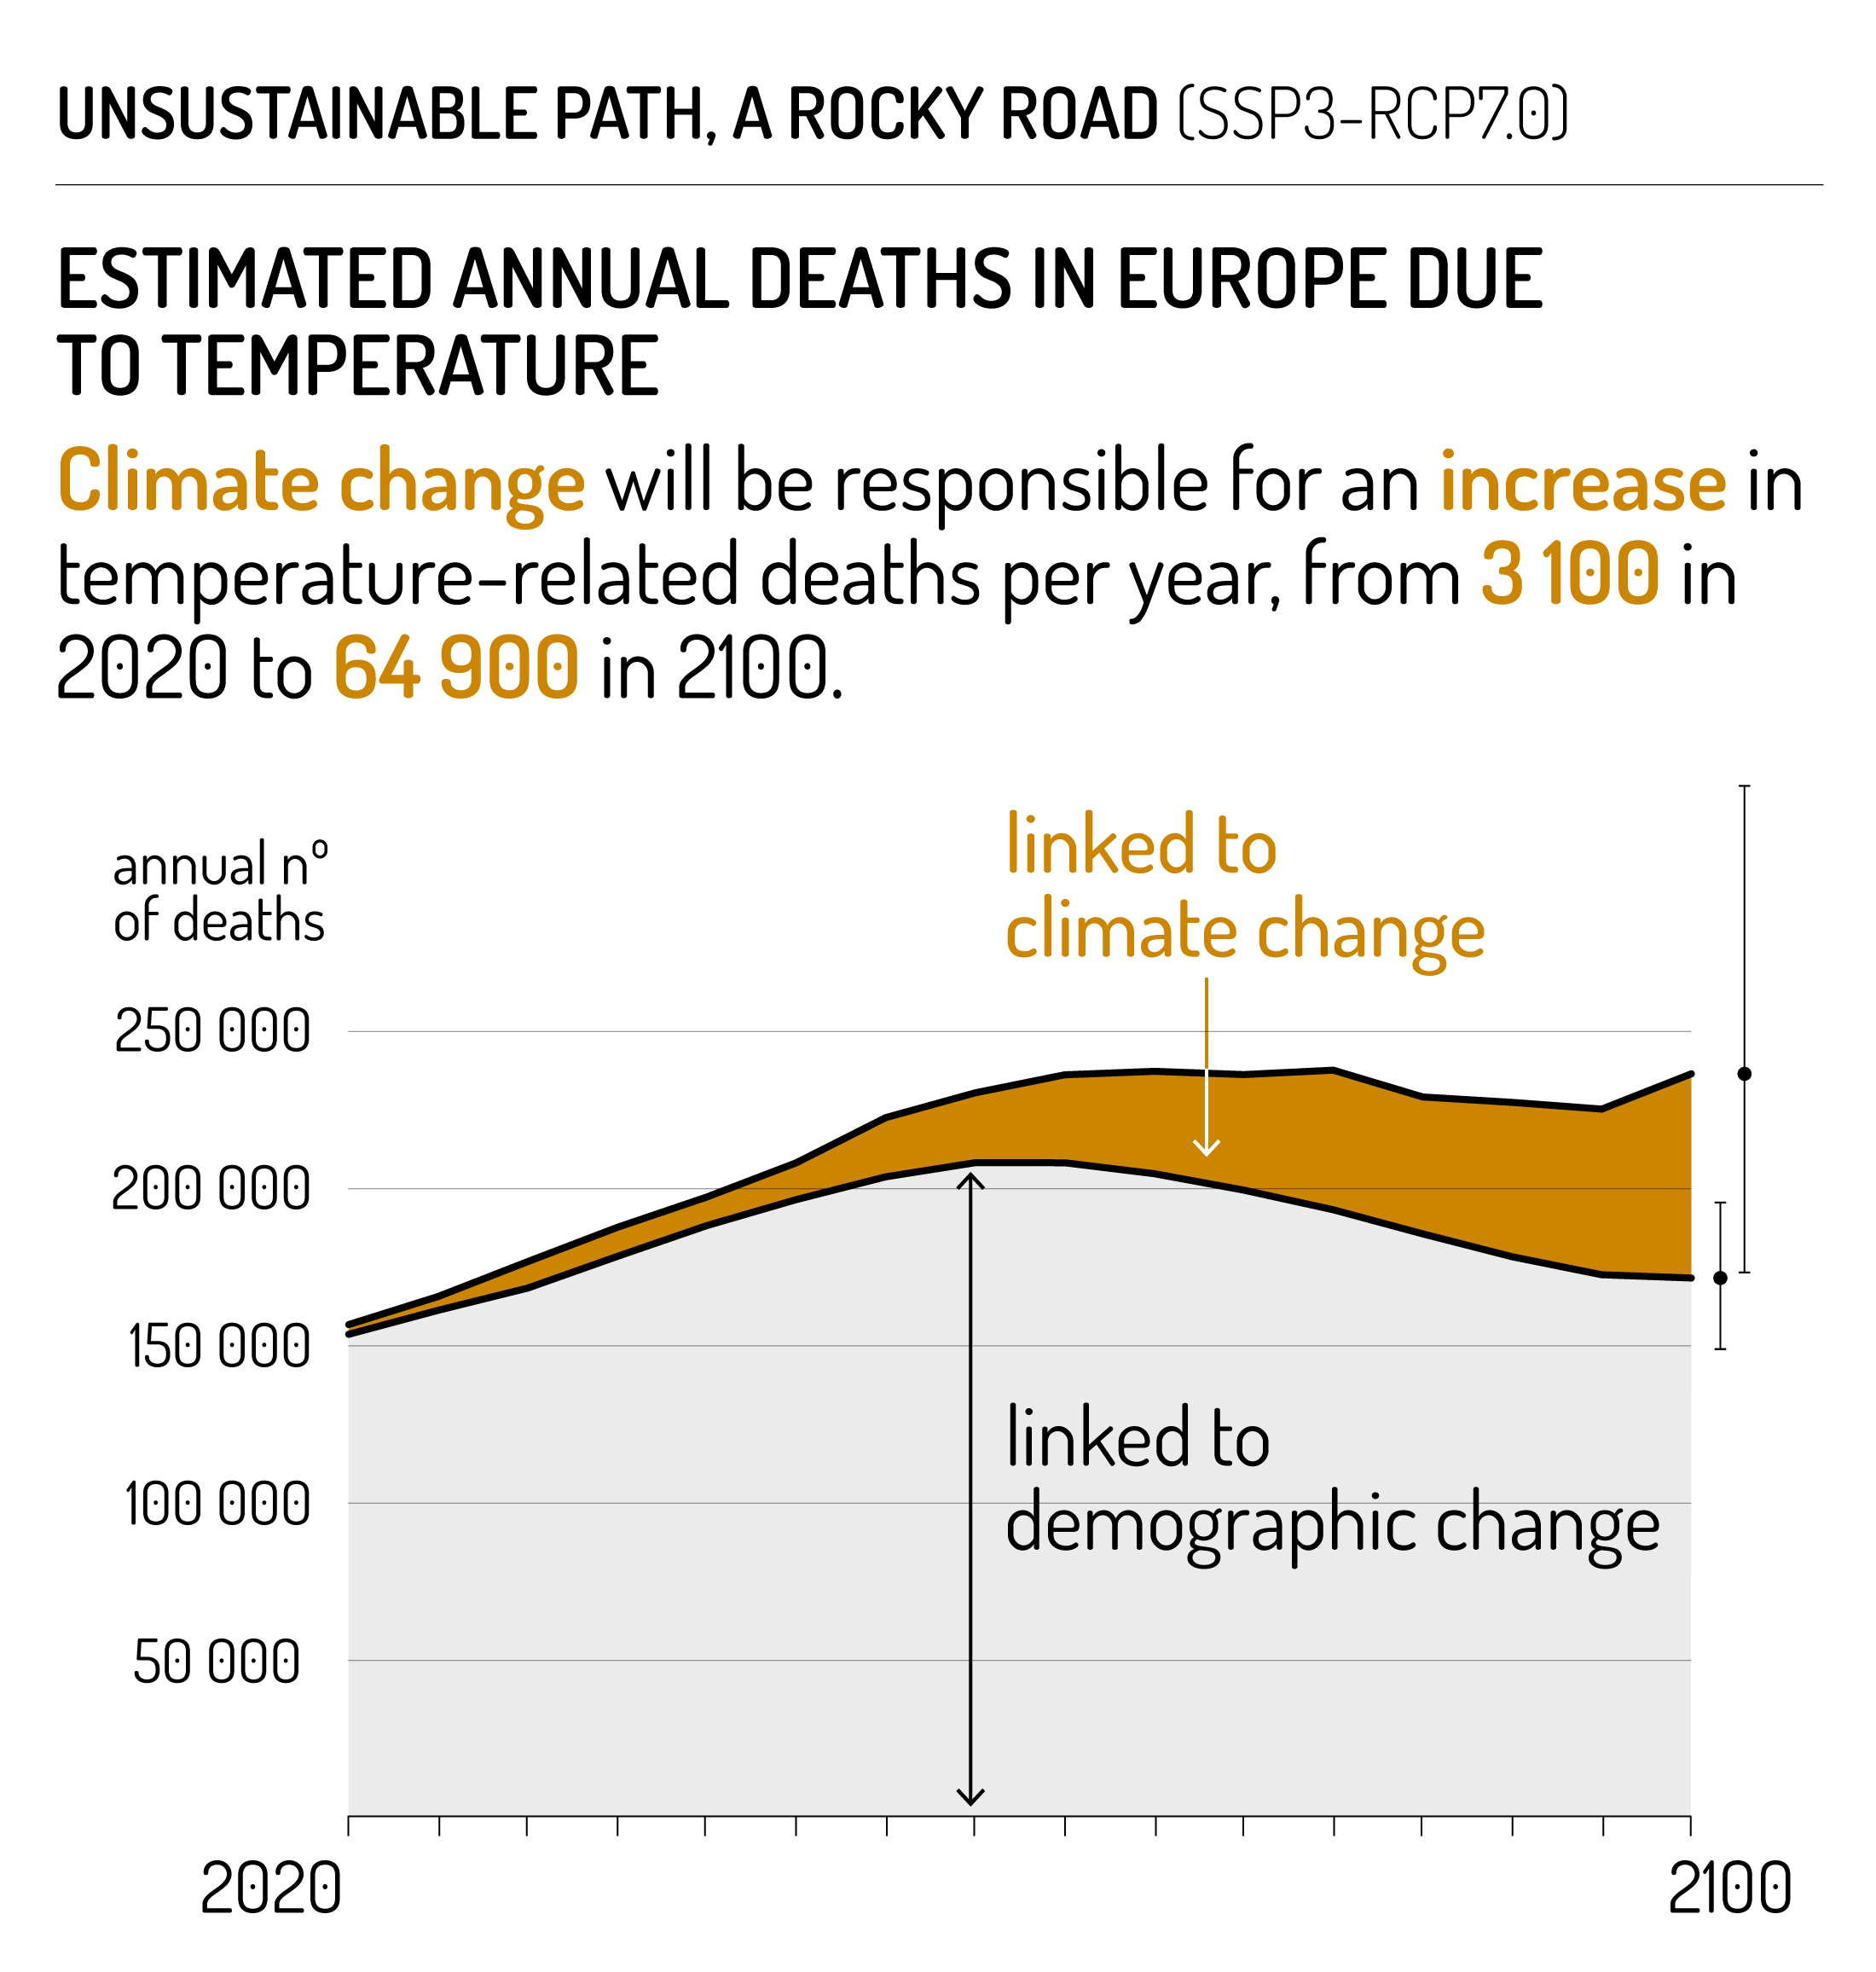
Estimated annual deaths in Europe due to temperature
These panels illustrate the projections of annual temperature-related deaths in Europe (heat and cold), with the orange part corresponding to the extra number of deaths caused only by climate change (visualised above for 5-year periods through the dotted stripes). With no climate change (grey), the two alternative projections indicate that the number of lives claimed by heat and cold would increase until 2050 because of population increase and ageing. This trend would then be reversed by the improvement of population health. However, under the most realistic scenario (SSP3-RCP7.0), climate change (orange) is expected to counteract this reversal and the number of deaths due to heat and cold remains high for the rest of the century.
Under the most optimistic scenario (SSP1-RCP2.6) on the other hand, projections show a general decrease of deaths due to heat and cold in the second half of the century.
Under the most optimistic scenario (SSP1-RCP2.6) on the other hand, projections show a general decrease of deaths due to heat and cold in the second half of the century.
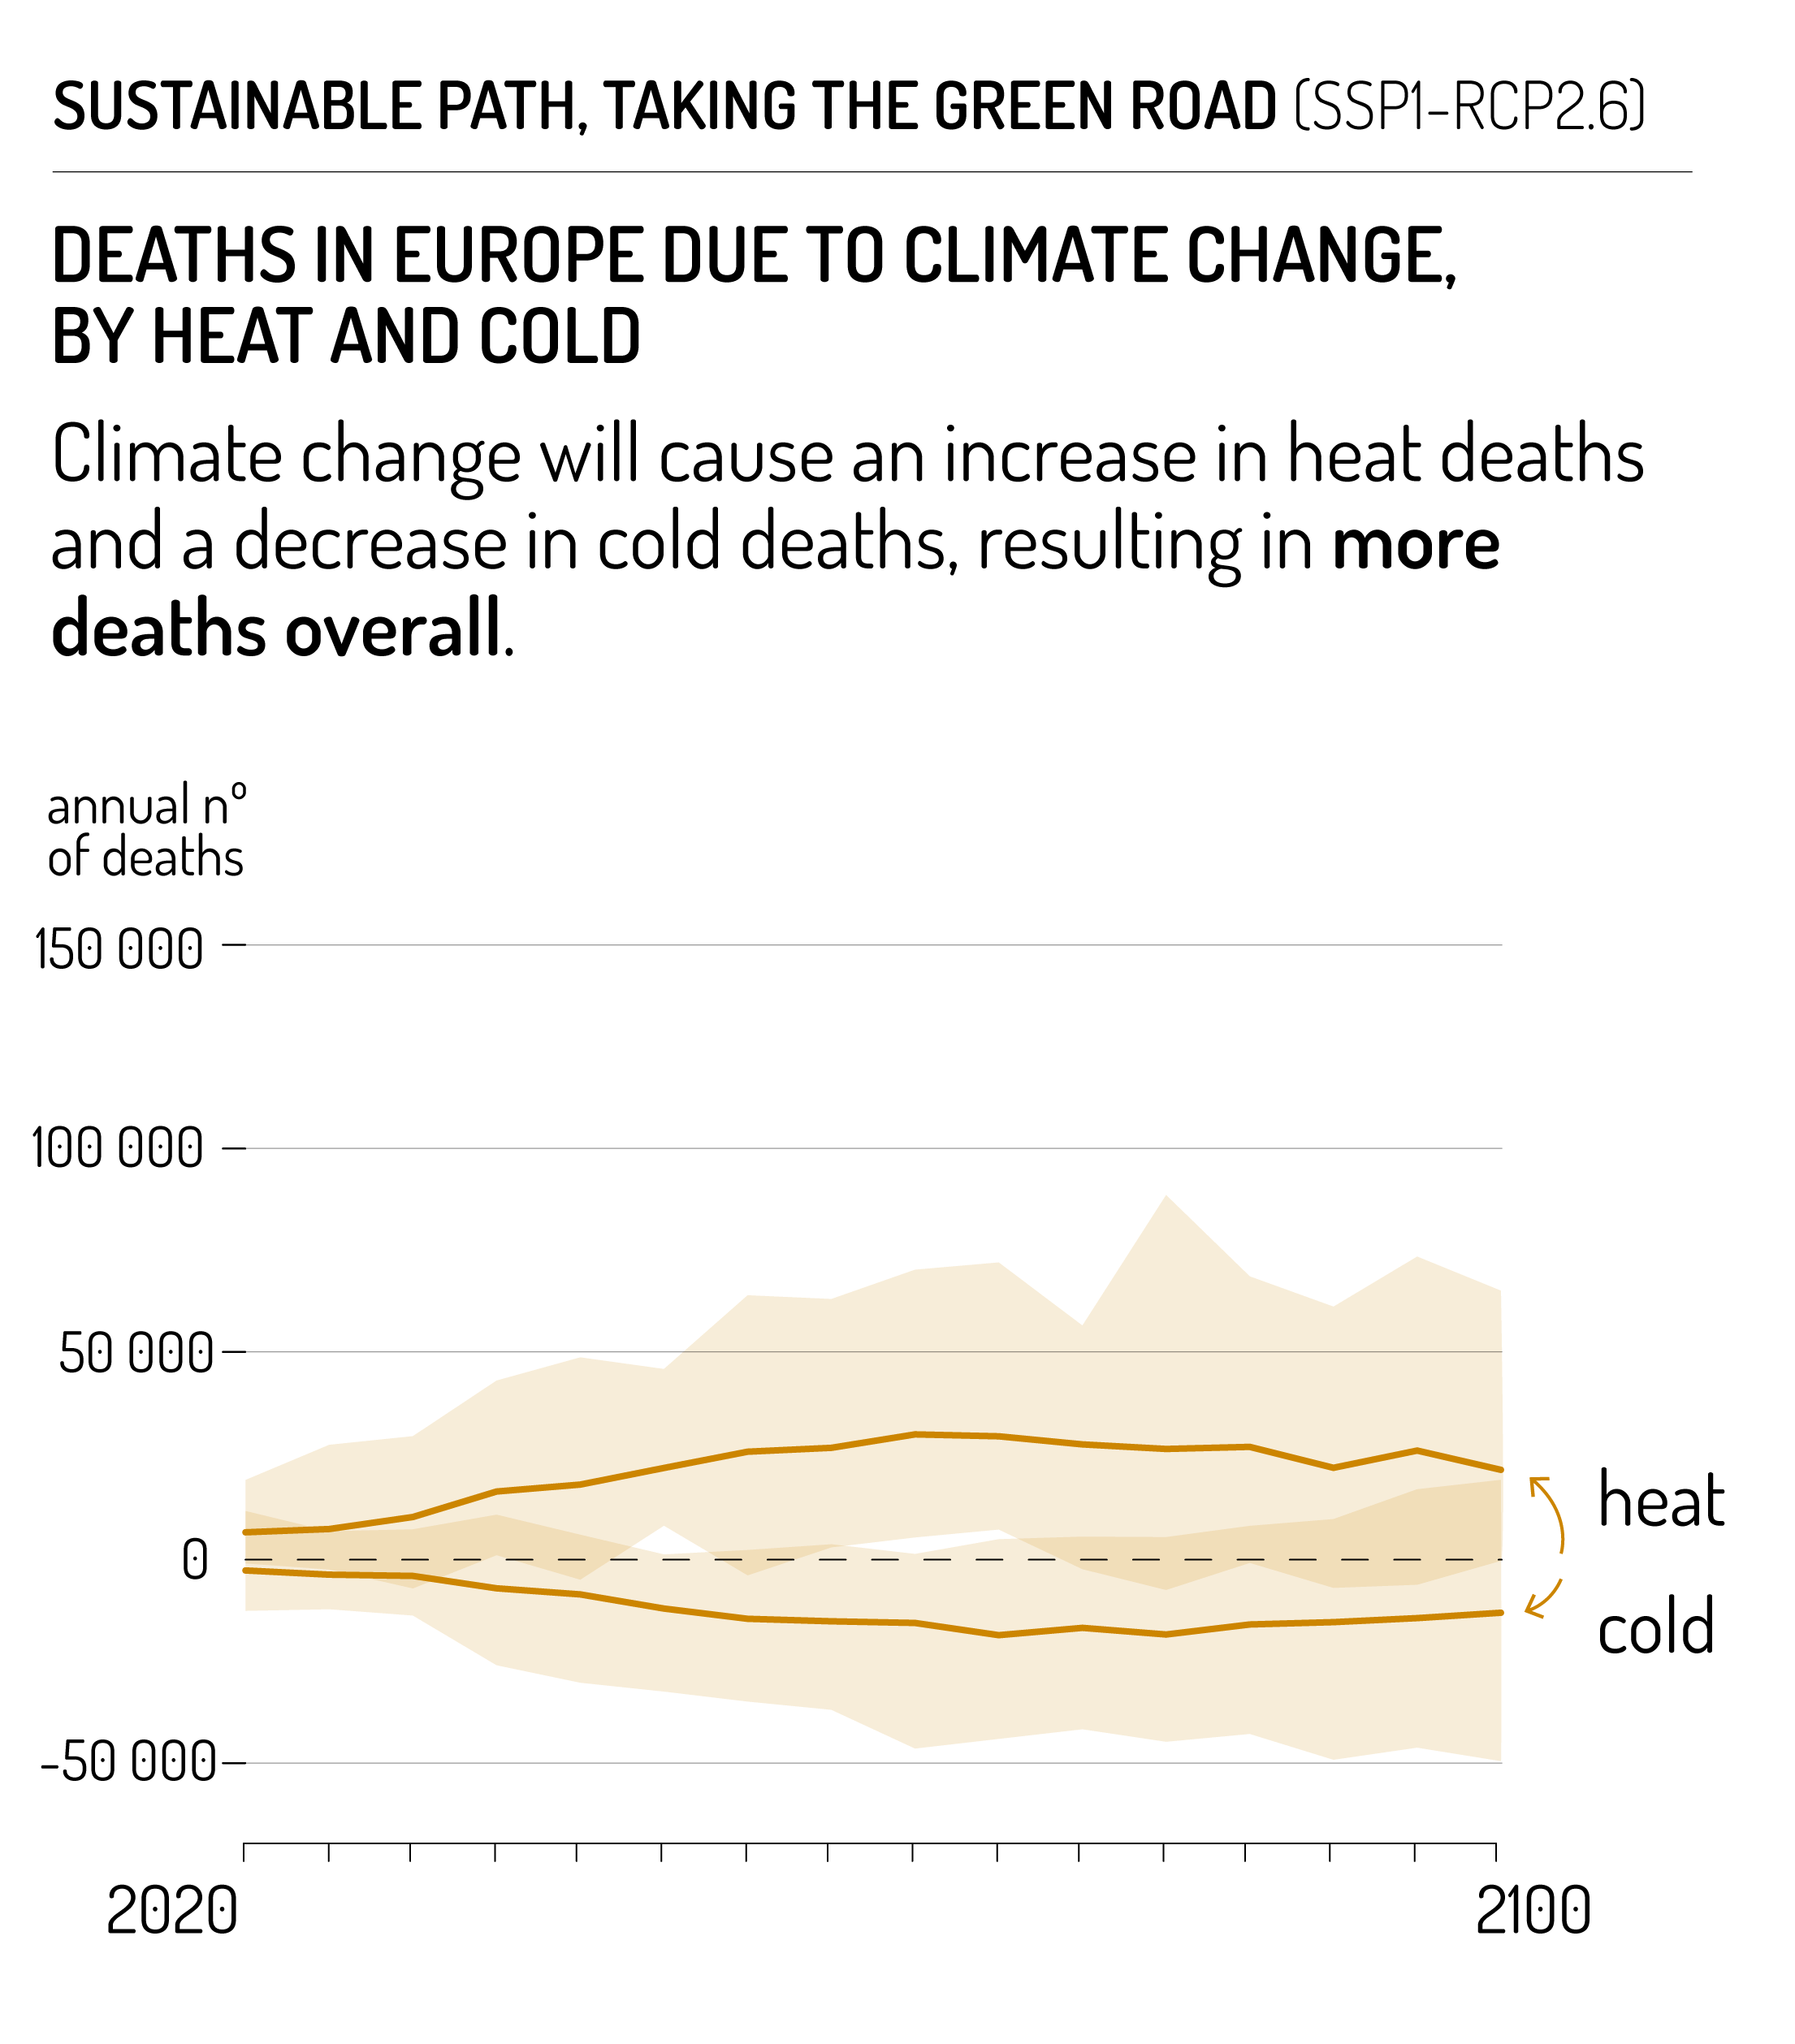
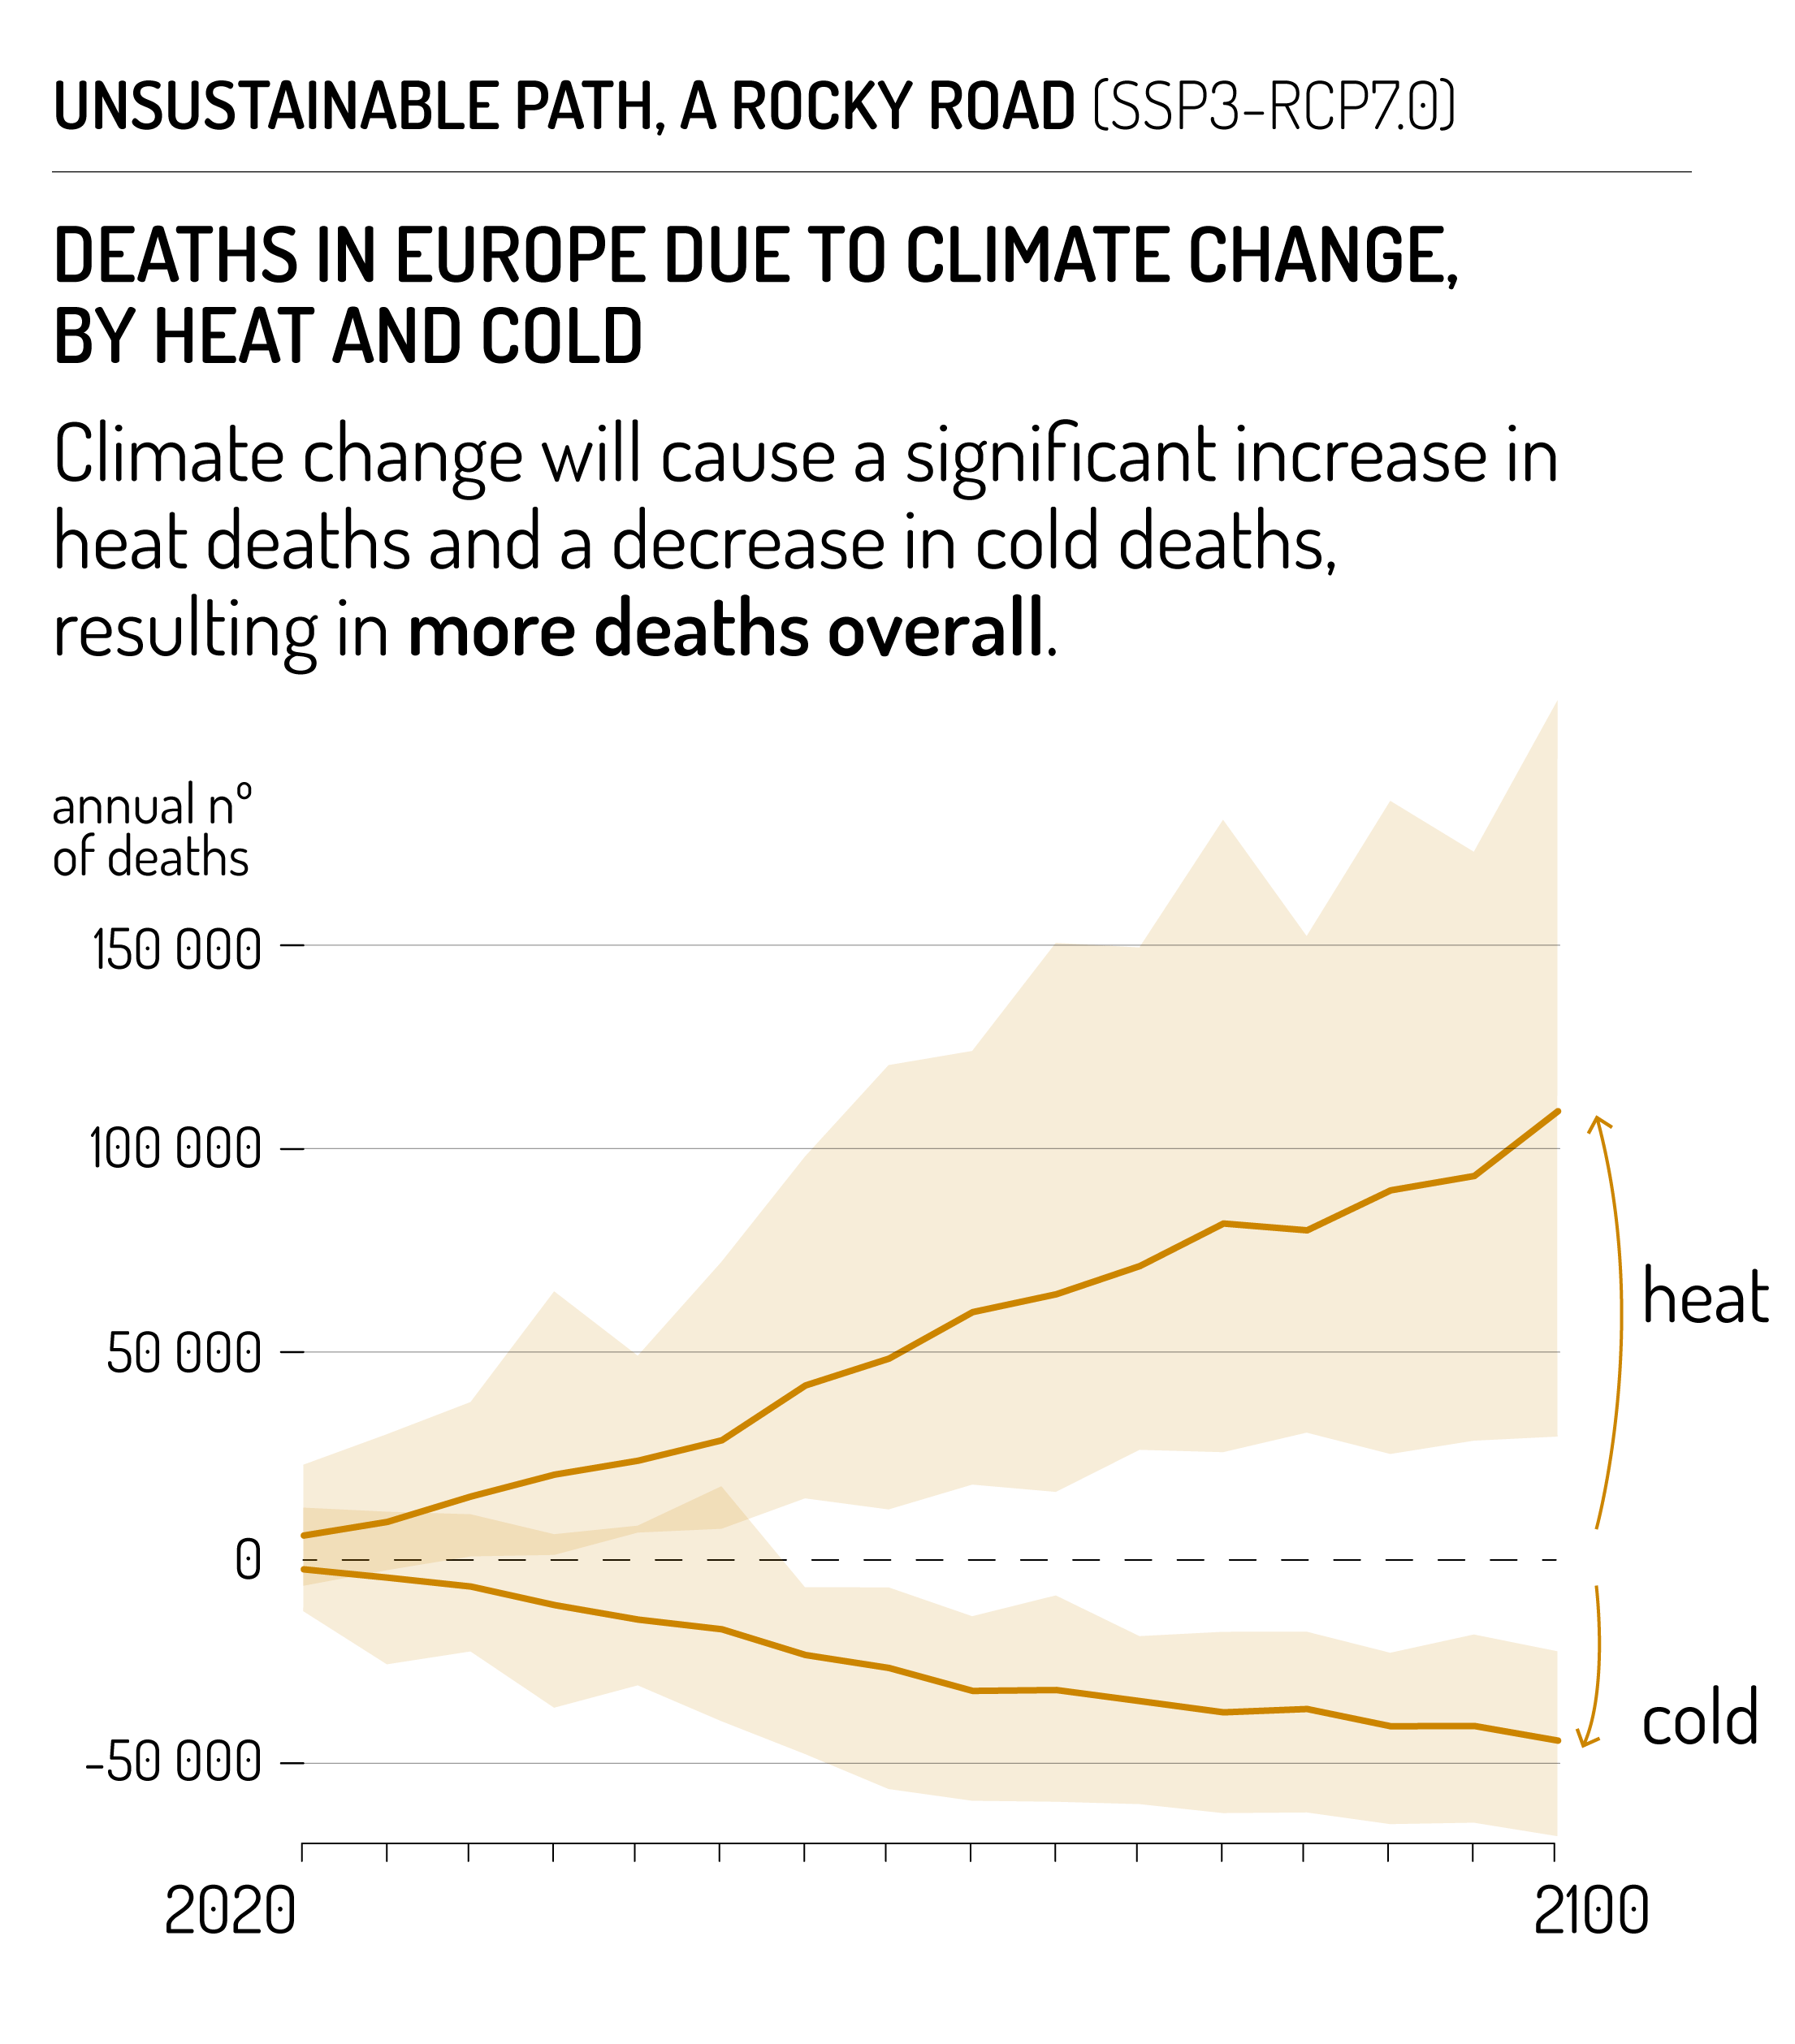
Deaths in Europe due to climate change by heat and cold
These visuals show the projected changes in annual deaths from heat and cold (separately) caused by climate change, in European cities.
Under the most realistic scenario (SSP3-RCP7.0), there is a steady decrease in deaths due to cold and a more rapid increase in deaths due to heat. While historically there were roughly 10 times as many cold deaths as heat deaths, at the end of the century there will be twice as many heat deaths as cold deaths in the high emission scenario. The visualisation shows the growing number of deaths related to heat, and the concurring avoided cold-related deaths.
In contrast, projections under the most optimistic scenario (SSP1-RCP2.6) indicate a slow decrease for cold and slow increase for heat until 2060 after when the numbers slightly return to the early century levels.
Conclusions
Mitigation and adaptation are urgently needed to save lives
Based on the results from EXHAUSTION we expect a steadily increasing health burden due to increasing temperatures over Europe. There are however large regional differences. There is a north-south gradient in heat-related deaths with southern European cities being badly affected today and even more so in the future, especially in the Mediterranean area. When it comes to cold-related deaths, results show a west-east gradient, with Eastern Europe particularly at risk. Despite these regional differences, the rapid growth in heat-related deaths is nevertheless expected to result in an increased temperature-related health burden almost everywhere. Swift and drastic reductions in the emissions of greenhouse gases are needed to reduce the health burden from increasing temperatures in the future. The socioeconomic and demographic developments have important bearings for the health risks. Given its ageing populations and persistent regional economic inequalities, Europe is likely facing an increasing number of temperature-related deaths. Implementing adaptation policies that effectively protect people from thermal stress and its consequences is imperative.
Assets
Link to dataset and the coding of the visualisation of deaths
This article is based on the Deliverable 4.4 “Summary report of health impact projections under climate change and adaptation scenarios” and it will be ready for download in the coming months.
A technical caption explaining the different visuals in detail.
Scenario SSP1 RCP 2.6 (Sustainable path, taking the green road)
In the SSP1 scenario, the world shifts towards a more sustainable path, reducing inequalities and investing more in health and education. Coupled with RCP 2.6, this represents a low greenhouse gases emission scenario that would reach net zero around 2075. In this scenario, warming would be expected to remain below 1.8°C.
Population growth in Europe is higher in SSP1 than in SSP3 and baseline mortality rates are lower.
Scenario SSP3 RCP 7.0 (Unsustainable path, a rocky road)
The SSP3 scenario assumes an increase in regional rivalries, a resurgence of nationalism and a low priority given to environmental concerns. Coupled with RCP7.0, this corresponds to a high greenhouse gas emission scenario in which emissions would double by the end of the century. Under this scenario, global warming would likely exceed 3.5°C at the end of the century.
Projected total number of temperature-related deaths caused by climate change between 2020 and 2100
Projected excess deaths due to climate change rely on exposure-response functions previously estimated for all cities with more than 50,000 inhabitants in the EU-27, Norway, Switzerland and the UK (openly shared on Zenodo). These functions indicate, for a specific temperature, what is the expected increase in mortality.
To estimate future excess deaths we retrieved projections of daily temperature for all cities from 19 General Circulation Models and projections of population and death rates for the 30 countries from 2010 to 2099.
For each SSP-RCP scenario, we projected annual excess deaths using two sub-scenarios: one in which we consider changes of both temperature and demographics, and one in which the distribution of temperature is kept constant across the century. The difference between these two scenarios (represented by the orange band) provides an estimation of heat and cold-related deaths that can be attributed to climate change. In this visualisation, one dot represents one such death.
Estimated annual deaths in Europe due to temperature
This visualisation represents the annual number of deaths estimated by our projections. The black solid lines represent the two sub-scenarios explained above, with the orange part representing what is attributed to climate change.
Uncertainty is obtained by repeating the projections for all 19 General Circulation Models, and for 1000 random perturbations of the underlying exposure-response functions. These two components respectively represent uncertainty from the temperature projections and the epidemiological analysis that derived mortality risks of temperature. Bands represent the 95% confidence interval, extracted as the 2.5% and 97.5% quantiles of the 19,000 projected excess mortality estimates.
Deaths in Europe due to climate change by heat and cold
In this visualisation, excess temperature-related deaths attributed to climate change are separated into heat and cold-related deaths. The definition of heat and cold vary by city and depends on the temperature with the lowest estimated mortality risk. Days with temperature lower than this reference temperature are considered cold days, and days with temperature higher are considered hot days.
Uncertainty is obtained by repeating the projections for all 19 General Circulation Models, and for 1000 random perturbations of the underlying exposure-response functions. These two components respectively represent uncertainty from the temperature projections and the epidemiological analysis that derived mortality risks of temperature. Bands represent the 95% confidence interval, extracted as the 2.5% and 97.5% quantiles of the 19,000 projected excess mortality estimates for heat and cold, respectively.
